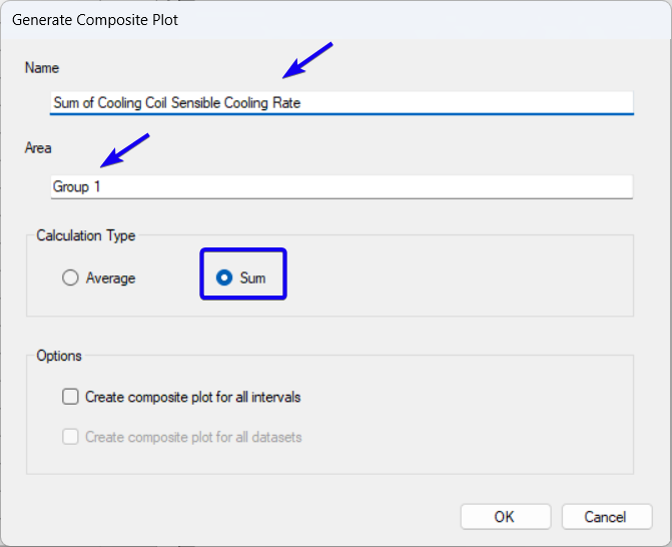
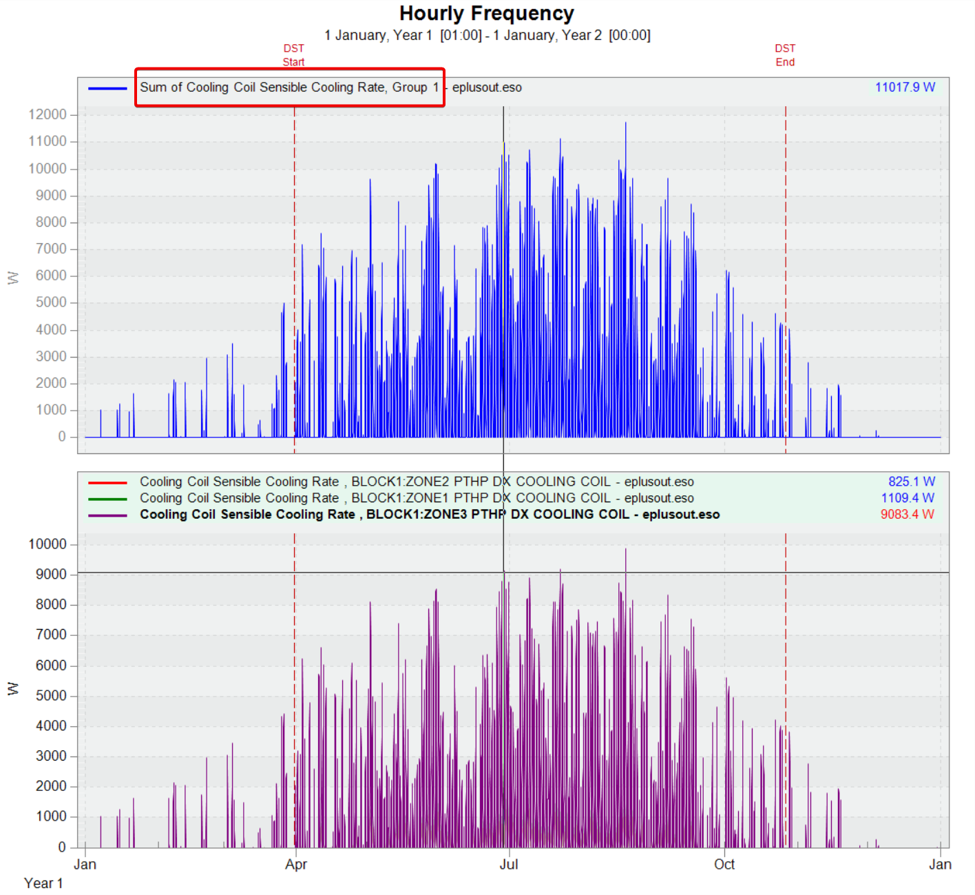
You can create your own "composite" output by summing or averaging 2 or more existing outputs. To create a composite plot first select 2 or more outputs of interest by left-clicking with the mouse. Hold the <Ctrl> key down when clicking to add new plots to the selection set. Once you have selected the source reports, click on the Create Composite Plot toolbar icon to open the Generate Composite Plot dialog.
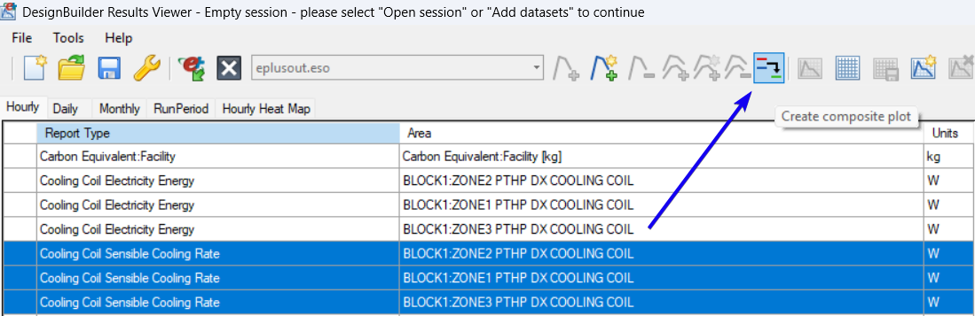
Note: The Create Composite Plot toolbar icon is only enabled when 2 or more plots of the same units are selected.
Tip: Zone name tags (for example, "Block 1_Zone1", "Block 2_Zone1") can be used to group zones, identify zone outputs, and filter results either directly in the Results Viewer (See Help page Results Viewer Data Display) or after export for post-processing analysis.
Was this article helpful?
That’s Great!
Thank you for your feedback
Sorry! We couldn't be helpful
Thank you for your feedback
Feedback sent
We appreciate your effort and will try to fix the article